Hilly's Reversal Scalping Strategy - 5 Min CandlesHow to Use
Copy the Code: Copy the script above.
Paste in TradingView: Open TradingView, go to the Pine Editor (bottom of the chart), paste the code, and click “Add to Chart.”
Set Timeframe: Ensure the chart is set to 5-minute candles (TradingView: right-click chart > Timeframe > 5 Minutes).
Check for Errors: Verify no errors appear in the Pine Editor console.
Apply to Chart: Use a liquid crypto pair (e.g., BTC/USDT, ETH/USDT on Binance or Coinbase).
Verify Signals:
Green “BUY” labels and triangle-up arrows for bullish reversals (e.g., bullish engulfing, hammer, doji, morning star, three white soldiers, double bottom in a downtrend).
Red “SELL” labels and triangle-down arrows for bearish reversals (e.g., bearish engulfing, shooting star, doji, evening star, three black crows, double top in an uptrend).
Green/red background highlights for signal candles.
Backtest: Use TradingView’s Strategy Tester to evaluate performance over 1–3 months, checking Net Profit, Win Rate, and Drawdown.
Demo Test: Run on a demo account to confirm signal visibility and performance before trading with real funds.
Troubleshooting
If Errors Occur: If any errors appear in TradingView’s Pine Editor console (e.g., “Syntax error” or “Invalid argument”), please share the exact error messages to diagnose environment-specific issues.
Signal Overload: If too many signals appear, increase patternLookback to 15 or set volFilter = volume > volMa * 2.0.
Missed Signals: If signals are too rare, set useVolumeFilter=false or reduce patternLookback to 5.
Additional Features: If you need alerts, other indicators (e.g., EMA, RSI), or dynamic arrow sizing, please specify. Note that dynamic sizing caused errors previously, so I’ve kept size=size.normal.
Pesquisar nos scripts por "the script"

Optimized ADX DI CCI Strategy### Key Features:
- Combines ADX, DI+/-, CCI, and RSI for signal generation.
- Supports customizable timeframes for indicators.
- Offers multiple exit conditions (Moving Average cross, ADX change, performance-based stop-loss).
- Tracks and displays trade statistics (e.g., win rate, capital growth, profit factor).
- Visualizes trades with labels and optional background coloring.
- Allows countertrading (opening an opposite trade after closing one).
1. **Indicator Calculation**:
- **ADX and DI+/-**: Calculated using the `ta.dmi` function with user-defined lengths for DI and ADX smoothing.
- **CCI**: Computed using the `ta.cci` function with a configurable source (default: `hlc3`) and length.
- **RSI (optional)**: Calculated using the `ta.rsi` function to filter overbought/oversold conditions.
- **Moving Averages**: Used for CCI signal smoothing and trade exits, with support for SMA, EMA, SMMA (RMA), WMA, and VWMA.
2. **Signal Generation**:
- **Buy Signal**: Triggered when DI+ > DI- (or DI+ crosses over DI-), CCI > MA (or CCI crosses over MA), and optional ADX/RSI filters are satisfied.
- **Sell Signal**: Triggered when DI+ < DI- (or DI- crosses over DI+), CCI < MA (or CCI crosses under MA), and optional ADX/RSI filters are satisfied.
3. **Trade Execution**:
- **Entry**: Long or short trades are opened using `strategy.entry` when signals are detected, provided trading is allowed (`allow_long`/`allow_short`) and equity is positive.
- **Exit**: Trades can be closed based on:
- Opposite signal (if no other exit conditions are used).
- MA cross (price crossing below/above the exit MA for long/short trades).
- ADX percentage change exceeding a threshold.
- Performance-based stop-loss (trade loss exceeding a percentage).
- **Countertrading**: If enabled, closing a trade triggers an opposite trade (e.g., closing a long opens a short).
4. **Visualization**:
- Labels are plotted at trade entries/exits (e.g., "BUY," "SELL," arrows).
- Optional background coloring highlights open trades (green for long, red for short).
- A statistics table displays real-time metrics (e.g., capital, win rates).
5. **Trade Tracking**:
- Tracks the number of long/short trades, wins, and overall performance.
- Monitors equity to prevent trading if it falls to zero.
### 2.3 Key Components
- **Indicator Calculations**: Uses `request.security` to fetch indicator data for the specified timeframe.
- **MA Function**: A custom `ma_func` handles different MA types for CCI and exit conditions.
- **Signal Logic**: Combines crossover/under checks with recent bar windows for flexibility.
- **Exit Conditions**: Multiple configurable exit strategies for risk management.
- **Statistics Table**: Updates dynamically with trade and capital metrics.
## 3. Configuration Options
The script provides extensive customization through input parameters, grouped for clarity in the TradingView settings panel. Below is a detailed breakdown of each setting and its impact.
### 3.1 Strategy Settings (Global)
- **Initial Capital**: Default `10000`. Sets the starting capital for backtesting.
- **Effect**: Determines the base equity for calculating position sizes and performance metrics.
- **Default Quantity Type**: `strategy.percent_of_equity` (50% of equity).
- **Effect**: Controls the size of each trade as a percentage of available equity.
- **Pyramiding**: Default `2`. Allows up to 2 simultaneous trades in the same direction.
- **Effect**: Enables multiple entries if conditions are met, increasing exposure.
- **Commission**: 0.2% per trade.
- **Effect**: Simulates trading fees, reducing net profit in backtesting.
- **Margin**: 100% for long and short trades.
- **Effect**: Assumes no leverage; adjust for margin trading simulations.
- **Calc on Every Tick**: `true`.
- **Effect**: Ensures real-time signal updates for precise execution.
### 3.2 Indicator Settings
- **Indicator Timeframe** (`indicator_timeframe`):
- **Options**: `""` (chart timeframe), `1`, `5`, `15`, `30`, `60`, `240`, `D`, `W`.
- **Default**: `""` (uses chart timeframe).
- **Effect**: Determines the timeframe for ADX, DI, CCI, and RSI calculations. A higher timeframe reduces noise but may delay signals.
### 3.3 ADX & DI Settings
- **DI Length** (`adx_di_len`):
- **Default**: `30`.
- **Range**: Minimum `1`.
- **Effect**: Sets the period for calculating DI+ and DI-. Longer periods smooth trends but reduce sensitivity.
- **ADX Smoothing Length** (`adx_smooth_len`):
- **Default**: `14`.
- **Range**: Minimum `1`.
- **Effect**: Smooths the ADX calculation. Longer periods produce smoother ADX values.
- **Use ADX Filter** (`use_adx_filter`):
- **Default**: `false`.
- **Effect**: If `true`, requires ADX to exceed the threshold for signals to be valid, filtering out weak trends.
- **ADX Threshold** (`adx_threshold`):
- **Default**: `25`.
- **Range**: Minimum `0`.
- **Effect**: Sets the minimum ADX value for valid signals when the filter is enabled. Higher values restrict trades to stronger trends.
### 3.4 CCI Settings
- **CCI Length** (`cci_length`):
- **Default**: `20`.
- **Range**: Minimum `1`.
- **Effect**: Sets the period for CCI calculation. Longer periods reduce noise but may lag.
- **CCI Source** (`cci_src`):
- **Default**: `hlc3` (average of high, low, close).
- **Effect**: Defines the price data for CCI. `hlc3` is standard, but users can choose other sources (e.g., `close`).
- **CCI MA Type** (`ma_type`):
- **Options**: `SMA`, `EMA`, `SMMA (RMA)`, `WMA`, `VWMA`.
- **Default**: `SMA`.
- **Effect**: Determines the moving average type for CCI signal smoothing. EMA is more responsive; VWMA weights by volume.
- **CCI MA Length** (`ma_length`):
- **Default**: `14`.
- **Range**: Minimum `1`.
- **Effect**: Sets the period for the CCI MA. Longer periods smooth the MA but may delay signals.
### 3.5 RSI Filter Settings
- **Use RSI Filter** (`use_rsi_filter`):
- **Default**: `false`.
- **Effect**: If `true`, applies RSI-based overbought/oversold filters to signals.
- **RSI Length** (`rsi_length`):
- **Default**: `14`.
- **Range**: Minimum `1`.
- **Effect**: Sets the period for RSI calculation. Longer periods reduce sensitivity.
- **RSI Lower Limit** (`rsi_lower_limit`):
- **Default**: `30`.
- **Range**: `0` to `100`.
- **Effect**: Defines the oversold threshold for buy signals. Lower values allow trades in more extreme conditions.
- **RSI Upper Limit** (`rsi_upper_limit`):
- **Default**: `70`.
- **Range**: `0` to `100`.
- **Effect**: Defines the overbought threshold for sell signals. Higher values allow trades in more extreme conditions.
### 3.6 Signal Settings
- **Cross Window** (`cross_window`):
- **Default**: `0`.
- **Range**: `0` to `5` bars.
- **Effect**: Specifies the lookback period for detecting DI+/- or CCI crosses. `0` requires crosses on the current bar; higher values allow recent crosses, increasing signal frequency.
- **Allow Long Trades** (`allow_long`):
- **Default**: `true`.
- **Effect**: Enables/disables new long trades. If `false`, only closing existing longs is allowed.
- **Allow Short Trades** (`allow_short`):
- **Default**: `true`.
- **Effect**: Enables/disables new short trades. If `false`, only closing existing shorts is allowed.
- **Require DI+/DI- Cross for Buy** (`buy_di_cross`):
- **Default**: `true`.
- **Effect**: If `true`, requires a DI+ crossover DI- for buy signals; if `false`, DI+ > DI- is sufficient.
- **Require CCI Cross for Buy** (`buy_cci_cross`):
- **Default**: `true`.
- **Effect**: If `true`, requires a CCI crossover MA for buy signals; if `false`, CCI > MA is sufficient.
- **Require DI+/DI- Cross for Sell** (`sell_di_cross`):
- **Default**: `true`.
- **Effect**: If `true`, requires a DI- crossover DI+ for sell signals; if `false`, DI+ < DI- is sufficient.
- **Require CCI Cross for Sell** (`sell_cci_cross`):
- **Default**: `true`.
- **Effect**: If `true`, requires a CCI crossunder MA for sell signals; if `false`, CCI < MA is sufficient.
- **Countertrade** (`countertrade`):
- **Default**: `true`.
- **Effect**: If `true`, closing a trade triggers an opposite trade (e.g., close long, open short) if allowed.
- **Color Background for Open Trades** (`color_background`):
- **Default**: `true`.
- **Effect**: If `true`, colors the chart background green for long trades and red for short trades.
### 3.7 Exit Settings
- **Use MA Cross for Exit** (`use_ma_exit`):
- **Default**: `true`.
- **Effect**: If `true`, closes trades when the price crosses the exit MA (below for long, above for short).
- **MA Length for Exit** (`ma_exit_length`):
- **Default**: `20`.
- **Range**: Minimum `1`.
- **Effect**: Sets the period for the exit MA. Longer periods delay exits.
- **MA Type for Exit** (`ma_exit_type`):
- **Options**: `SMA`, `EMA`, `SMMA (RMA)`, `WMA`, `VWMA`.
- **Default**: `SMA`.
- **Effect**: Determines the MA type for exit signals. EMA is more responsive; VWMA weights by volume.
- **Use ADX Change Stop-Loss** (`use_adx_stop`):
- **Default**: `false`.
- **Effect**: If `true`, closes trades when the ADX changes by a specified percentage.
- **ADX % Change for Stop-Loss** (`adx_change_percent`):
- **Default**: `5.0`.
- **Range**: Minimum `0.0`, step `0.1`.
- **Effect**: Specifies the percentage change in ADX (vs. previous bar) that triggers a stop-loss. Higher values reduce premature exits.
- **Use Performance Stop-Loss** (`use_perf_stop`):
- **Default**: `false`.
- **Effect**: If `true`, closes trades when the loss exceeds a percentage threshold.
- **Performance Stop-Loss (%)** (`perf_stop_percent`):
- **Default**: `-10.0`.
- **Range**: `-100.0` to `0.0`, step `0.1`.
- **Effect**: Specifies the loss percentage that triggers a stop-loss. More negative values allow larger losses before exiting.
## 4. Visual and Statistical Output
- **Labels**: Displayed at trade entries/exits with arrows (↑ for buy, ↓ for sell) and text ("BUY," "SELL"). A "No Equity" label appears if equity is zero.
- **Background Coloring**: Optionally colors the chart background (green for long, red for short) to indicate open trades.
- **Statistics Table**: Displayed at the top center of the chart, updated on timeframe changes or trade events. Includes:
- **Capital Metrics**: Initial capital, current capital, capital growth (%).
- **Trade Metrics**: Total trades, long/short trades, win rate, long/short win rates, profit factor.
- **Open Trade Status**: Indicates if a long, short, or no trade is open.
## 5. Alerts
- **Buy Signal Alert**: Triggered when `buy_signal` is true ("Cross Buy Signal").
- **Sell Signal Alert**: Triggered when `sell_signal` is true ("Cross Sell Signal").
- **Usage**: Users can set up TradingView alerts to receive notifications for trade signals.

NIFTY_2min_FVG_Buy_StrategySummary
This strategy is designed for scalping Nifty on a 2-minute chart, focusing exclusively on long entries. The script's purpose is to identify and act on specific bullish reversal patterns based on volume analysis and price action.
Concept & Core Logic
The strategy operates on a two-stage confirmation process:
Volume Absorption: The initial condition seeks to identify potential bullish reversals by detecting signs of selling pressure being absorbed by buyers. This suggests that a downward move may be losing momentum.
Fair Value Gap (FVG) Confirmation: After a volume absorption signal, the strategy waits for a Fair Value Gap (FVG) to appear. A long entry signal is generated only after a candle closes above the FVG zone, serving as confirmation of bullish intent.
Risk Management
The strategy employs a fixed take profit and stop loss for each trade, based on the Nifty underlying price:
Take Profit: The exit signal is triggered when a trade reaches a 25-point profit.
Stop Loss: The exit signal is triggered when a trade reaches a 30-point loss.
Intended Use
This tool is intended for traders who:
Utilize mechanical, rule-based systems for intraday trading and scalping.
Are interested in studying a structured approach that combines volume analysis with price action inefficiencies like Fair Value Gaps.

EMA Crossover StrategyAs the name suggests. It is an EMA crossover with a custom buy, sell signal on the chart with the take profit signal on the chart itself. SL would be the original candle low on the candle where the buy sell signal is generated. kindly give a feedback on the script so i can update it.

Supertrend Strategy with ATR TP and SLSupertrend Strategy with ATR TP and SL
Overview
The Supertrend strategy is a trend-following trading system that utilizes the Average True Range (ATR) to determine the market's volatility and to set dynamic support and resistance levels. This strategy employs the Supertrend indicator to identify entry and exit points for trades, specifically focusing on long and short positions in the market.
Key Components
Inputs
ATR Period: This defines the lookback period for calculating the ATR, which helps in understanding market volatility. The default value is set to 10.
Supertrend Multiplier: This multiplier adjusts the sensitivity of the Supertrend indicator. A value of 3 is used, affecting the upper and lower bands of the Supertrend calculation.
TP (Take Profit) ATR Multiplier: This multiplier is used to calculate the take profit level based on the ATR (default value is 3).
SL (Stop Loss) ATR Multiplier: This multiplier dictates the stop loss distance from the entry point concerning the ATR, set to a value of 1.5.
Number of Bars to Use for Backtest: This setting determines how many bars are analyzed during testing, set to a default of 240.
Trading Mode: Options are provided to choose whether to take only long positions or only short positions.
ATR Calculation
The ATR is computed using a specified period, allowing traders to gauge market volatility effectively. This is crucial for setting appropriate stop loss and take profit levels.
Supertrend Calculation
The Supertrend indicator is calculated using the ATR and the multiplier to derive upper and lower bands. The current market price is compared against these bands to determine the trend direction.
Trade Signals
Buy Signal: Generated when the price closes above the Supertrend line, indicating a potential upward trend.
Sell Signal: Generated when the price closes below the Supertrend line, indicating a potential downward trend.
Entry and Exit Strategies
When a buy signal is triggered, the strategy will enter a long position while setting the take profit and stop loss based on the ATR values.
Conversely, if a sell signal occurs, a short position is opened with respective take profit and stop loss levels.
Alert Conditions
Alerts are set up for both buy and sell signals, allowing users to be notified when trade opportunities arise.
Visualization
The Supertrend line is plotted on the chart, along with take profit and stop loss levels for each trade. Labels indicate entry points to facilitate easy tracking of trades.
Conclusion
This Supertrend strategy is designed to simplify trading decisions by automating the entry and exit points based on well-defined market conditions. By utilizing the ATR for dynamic risk management, traders can adapt their approach according to market volatility. This strategy is suitable for many trading styles and can be backtested to assess its performance across different market conditions.
Usage
To use this strategy, simply apply the script in TradingView and adjust the input parameters based on your trading preferences. The strategy can be modified further to enhance its performance according to specific market scenarios.
Hassi XAUUSD Advanced FVG EMA/BOS/RSI/Volume + Session FilterWhat it does :
This strategy automates a popular ICT-style idea on XAUUSD (Gold): trade only when price taps back into a Fair Value Gap (FVG), but filter entries with trend, structure, momentum, volume, and session rules. It manages risk with fixed TP/SL (points) and shows a compact backtest panel on chart.
Core Logic
1) Market Structure (BOS)
Detects recent swing highs/lows and flags a Break of Structure:
BOS Up when price breaks the latest swing high.
BOS Down when price breaks the latest swing low.
2) FVG Detection (3-candle)
Bullish FVG when low > high and low > high .
Bearish FVG when high < low and high < low .
The most recent qualifying gap is drawn as a shaded box (optional).
3) Bias & Filters
Trend Bias: price vs EMA (default 200). Longs only above EMA; shorts only below.
Momentum: optional RSI filter (default 14); avoid longs in OB & shorts in OS.
Volume: optional filter requiring current volume > SMA(20) × multiplier.
Sessions: optional London / New York (PKT) time windows.
Entries & Exits
Long Entry (all must be true)
Above EMA, RSI bullish, volume ok, session ok, BOS Up.
A recent Bullish FVG exists (within N bars).
Price taps back into the FVG (low ≤ top & close > bottom) with a bullish candle.
Short Entry (mirror)
Below EMA, RSI bearish, volume ok, session ok, BOS Down.
A recent Bearish FVG exists (within N bars).
Price taps (high ≥ bottom & close < top) with a bearish candle.
Risk / R:R
Exits use fixed points on XAUUSD (default TP 100, SL 50).
On many gold feeds 1.0 = 10 points; inputs convert to price automatically.
“One-trade-at-a-time”: a new signal won’t fire until the previous position is flat.
Chart Labels
On entry, the script plots BUY/SELL plus fixed TP/SL lines & labels anchored to the entry bar (they don’t drift with price).
Visuals & Tools
EMA line (green/red by bias).
Swing points (tiny triangles) to see structure.
FVG boxes (green/red, optional).
Session shading (subtle blue overlay).
Stats Panel (top-right):
Total Trades, TP Hits, SL Hits, Win Rate, Profit Factor, Net P&L.
Inputs (quick guide)
EMA Length (default 200)
Swing Lookback for BOS (default 5)
FVG Box Length (how far the zone extends to the right)
TP / SL (points) for XAUUSD + display Risk:Reward
Sessions (PKT): London & New York windows + toggle
Filters: Volume (multiplier), RSI (length, OB/OS)
Visibility: show/hide FVG boxes & TP/SL drawings
Alerts
Buy Signal / Sell Signal on valid entries
Position Opened / Position Closed notifications
Best Practices & Notes
Designed for XAUUSD 15-minute. You can test other timeframes, but retune TP/SL points and filters accordingly.
Broker ticks differ: if your symbol steps are not 0.1, adjust TP/SL points.
Use with a HTF confluence (e.g., D1/4H bias, key S/R, news awareness).
Backtests are approximations; real results vary with spreads, slippage, and execution.
Disclaimer: This tool is for educational purposes. It is not financial advice. Always test before using on live capital.

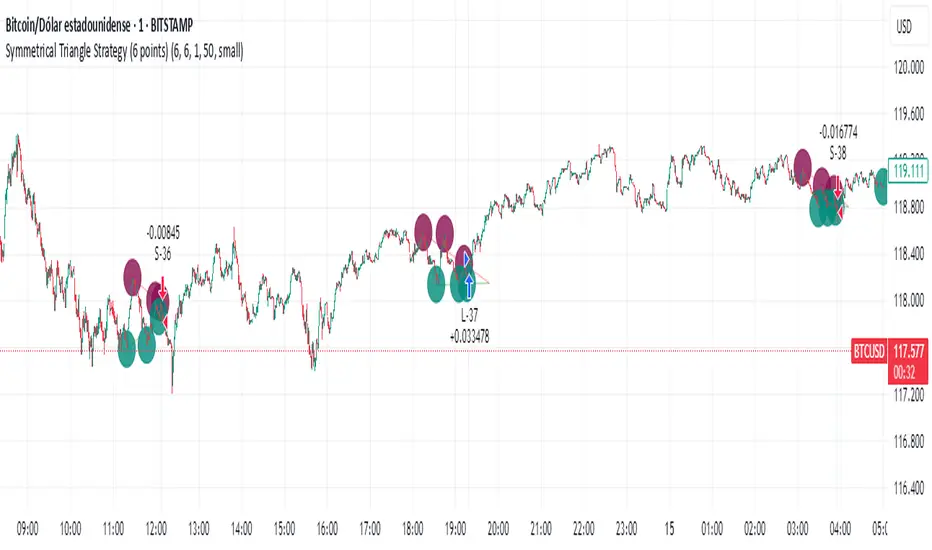
Simple Symmetrical Triangle Strategy (6 points)Overview
This strategy identifies triangle patterns formed by a series of key high and low price points. A trade is triggered when the price breaks out from the pattern's final confirmation points: a buy signal occurs on a close above the last high point, and a sell signal on a close below the last low point. To ensure relevance, any pattern that doesn't break out within 10 bars is automatically discarded.
This helps filter out patterns that lose momentum and focuses only on the most imminent breakouts.
How It Works
1. Pattern Detection: The script continuously scans for a sequence of three declining highs (points H1, H2, H3) and three rising lows (points L1, L2, L3) to form a triangle.
2. Entry Logic: The logic is straightforward and based on breaking the last confirmed pivot:
* Long Entry: A buy order is executed if the price closes above the level of the last high (H3).
* Short Entry: A sell order is executed if the price closes below the level of the last low (L3).
3. Pattern Expiration: A triangle only remains "active" for 10 bars after its formation. If a breakout doesn't occur within this window, the pattern is removed from analysis, avoiding trades on prolonged, unresolved consolidations.
Key Features
* Automatic Detection: Identifies and draws triangles for you.
* Simple Breakout Logic: Easy to understand, trades by following the price action.
* Time Filter: Its main advantage is discarding patterns that do not resolve quickly.
* Customizable: You can adjust the sensitivity of the pivot detection in the settings.
Important Disclaimer
This strategy is designed as an entry system and DOES NOT INCLUDE A STOP LOSS OR TAKE PROFIT.
Automation Ready
Want to automate this or ANY strategy on your broker or MetaTrader (MT4/MT5) without keeping your computer on or needing a VPS? You can use WebhookTrade.
Breakout asia USD/CHF1 — Customizable Parameters
sess1 & sess2: The two time ranges that define the Asian session (e.g., 20:00–23:59 and 00:00–08:00).
Important: format is HHMM-HHMM.
rr: The risk/reward ratio (default = 3.0, meaning TP = 3× risk size).
onePerSess: Toggle to allow only one trade per Asian session or multiple.
bufTicks: Extra margin for the SL beyond the signal candle.
2 — Detecting the Asian Session
The script checks if the candle’s time is inside the first range (sess1) or inside the second range (sess2).
While inside the Asian session, it updates the current high and low.
When the session ends, it locks in these levels as rangeHigh and rangeLow.
3 — Step 1: Detecting the Initial Breakout
Bullish breakout → close above rangeHigh → flag breakoutUp is set to true.
Bearish breakout → close below rangeLow → flag breakoutDown is set to true.
No trade yet — this is just the breakout signal.
4 — Step 2: Waiting for the Retest
If a bullish breakout occurred, wait for the price to return to or slightly below rangeHigh and then close back above it.
If a bearish breakout occurred, wait for the price to return to or slightly above rangeLow and then close back below it.
5 — Entry & Exit
When the retest is confirmed:
strategy.entry() is triggered.
SL = behind the retest confirmation candle (with optional bufTicks margin).
TP = entry price ± RR × risk size.
If onePerSess is enabled, no further trades happen until the next Asian session.
6 — Chart Display
Green line = locked Asian session high.
Red line = locked Asian session low.
Light blue background = active Asian session hours.
Trade entries are shown on the chart when retests occur.

Ultimate Scalping Strategy v2Strategy Overview
This is a versatile scalping strategy designed primarily for low timeframes (like 1-min, 3-min, or 5-min charts). Its core logic is based on a classic EMA (Exponential Moving Average) crossover system, which is then filtered by the VWAP (Volume-Weighted Average Price) to confirm the trade's direction in alignment with the market's current intraday sentiment.
The strategy is highly customizable, allowing traders to add layers of confirmation, control trade direction, and manage exits with precision.
Core Strategy Logic
The strategy's entry signals are generated when two primary conditions are met simultaneously:
Momentum Shift (EMA Crossover): It looks for a crossover between a fast EMA (default length 9) and a slow EMA (default length 21).
Buy Signal: The fast EMA crosses above the slow EMA, indicating a potential shift to bullish momentum.
Sell Signal: The fast EMA crosses below the slow EMA, indicating a potential shift to bearish momentum.
Trend/Sentiment Filter (VWAP): The crossover signal is only considered valid if the price is on the "correct" side of the VWAP.
For a Buy Signal: The price must be trading above the VWAP. This confirms that, on average, buyers are in control for the day.
For a Sell Signal: The price must be trading below the VWAP. This confirms that sellers are generally in control.
Confirmation Filters (Optional)
To increase the reliability of the signals and reduce false entries, the strategy includes two optional confirmation filters:
Price Action Filter (Engulfing Candle): If enabled (Use Price Action), the entry signal is only valid if the crossover candle is also an "engulfing" candle.
A Bullish Engulfing candle is a large green candle that completely "engulfs" the body of the previous smaller red candle, signaling strong buying pressure.
A Bearish Engulfing candle is a large red candle that engulfs the previous smaller green candle, signaling strong selling pressure.
Volume Filter (Volume Spike): If enabled (Use Volume Confirmation), the entry signal must be accompanied by a surge in volume. This is confirmed if the volume of the entry candle is greater than its recent moving average (default 20 periods). This ensures the move has strong participation behind it.
Exit Strategy
A position can be closed in one of three ways, creating a comprehensive exit plan:
Stop Loss (SL): A fixed stop loss is set at a level determined by a multiple of the Average True Range (ATR). For example, a 1.5 multiplier places the stop 1.5 times the current ATR value away from the entry price. This makes the stop dynamic, adapting to market volatility.
Take Profit (TP): A fixed take profit is also set using an ATR multiplier. By setting the TP multiplier higher than the SL multiplier (e.g., 2.0 for TP vs. 1.5 for SL), the strategy aims for a positive risk-to-reward ratio on each trade.
Exit on Opposite Signal (Reversal): If enabled, an open position will be closed automatically if a valid entry signal in the opposite direction appears. For example, if you are in a long trade and a valid short signal occurs, the strategy will exit the long position immediately. This feature turns the strategy into more of a reversal system.
Key Features & Customization
Trade Direction Control: You can enable or disable long and short trades independently using the Allow Longs and Allow Shorts toggles. This is useful for trading in harmony with a higher-timeframe trend (e.g., only allowing longs in a bull market).
Visual Plots: The strategy plots the Fast EMA, Slow EMA, and VWAP on the chart for easy visualization of the setup. It also plots up/down arrows to mark where valid buy and sell signals occurred.
Dynamic SL/TP Line Plotting: A standout feature is that the strategy automatically draws the exact Stop Loss and Take Profit price lines on the chart for every active trade. These lines appear when a trade is entered and disappear as soon as it is closed, providing a clear visual of your risk and reward targets.
Alerts: The script includes built-in alertcondition calls. This allows you to create alerts in TradingView that can notify you on your phone or execute trades automatically via a webhook when a long or short signal is generated.

ICT OTE StrategyStrategy Overview
This strategy is designed to automate a specific trading setup based on the concepts of Inner Circle Trader (ICT). Its primary goal is to identify significant market structure swings, frame a Fibonacci retracement over the most recent price leg, and execute a trade when the price pulls back to a key user-defined level. It is a counter-trend entry strategy, meaning it looks to enter a trade during a pullback within an established trend.
How It Works: Step-by-Step
1. Swing Detection:
The strategy first identifies significant swing highs and swing lows.
A swing high is confirmed only if it's higher than a specific number of bars to its left and right (defined by "Left Strength" and "Right Strength" in the settings).
The same logic applies to swing lows, which must be lower than the bars around them. This filtering ensures only structurally important turning points are considered.
2. Defining the Trading Range:
Once a new swing is confirmed, the strategy defines the most recent dealing range.
If a new swing high forms, the range is drawn from the previous swing low up to this new high. This is considered a bullish leg.
If a new swing low forms, the range is drawn from the previous swing high down to this new low. This is considered a bearish leg.
3. Fibonacci Retracement & Trade Setup:
An automatic Fibonacci retracement tool is drawn over this newly defined dealing range. The 0.0 level is placed at the end of the move, and the 1.0 level is at the beginning.
The strategy then prepares to enter a trade based on this range.
4. Trade Execution:
Entry: A limit order is placed at a specific Fibonacci level within the range, waiting for the price to retrace. The default entry is the 0.618 level, but this can be changed in the settings.
For a bullish leg, it places a LONG (Buy) order, anticipating that the price will bounce from the retracement level.
For a bearish leg, it places a SHORT (Sell) order, anticipating that the price will be rejected from the retracement level.
Stop Loss: The Stop Loss is automatically placed at the 1.0 level of the Fibonacci range. This is the point where the original trade idea is invalidated.
Take Profit: The Take Profit is automatically placed at the 0.0 level of the Fibonacci range. This is the target at the end of the price leg.
Key Features & Customization
Automated Trade Logic: The entire process, from identifying the setup to placing the entry, stop loss, and take profit, is fully automated.
Visual Aid: The script draws the swing points and the Fibonacci retracement on the chart, so you can visually confirm the setups the strategy is taking.
Customizable Entry: You can change the "Entry Level" in the settings to test different Fibonacci levels, such as the Optimal Trade Entry (OTE) at 0.705.
Toggle Visuals: You can turn the Fibonacci drawing on or off to keep your chart clean while still allowing the strategy to run in the background.

Opening-Range BreakoutNote: Default trading date range looks mediocre. Set date range to "Entire History" to see full effect of the strategy. 50.91% profitable trades, 1.178 profit factor, steady profits and limited drawdown. Total P&L: $154,141.18, Max Drawdown: $18,624.36. High R^2
█ Overview
The Opening-Range Breakout strategy is a mechanical, session‑based day‑trading system designed to capture the initial burst of directional momentum immediately following the market open. It defines a user‑configurable “opening range” window, measures its high and low boundaries, then places breakout stop orders at those levels once the range closes. Built‑in filters on minimum range width, reward‑to‑risk ratios, and optional reversal logic help refine entries and manage risk dynamically.
█ How It Works
Opening‑Range Formation
Between 9:30–10:15 AM ET (configurable), the script tracks the highest high and lowest low to form the day’s opening range box.
On the first bar after the range window closes, the range high (OR_high) and low (OR_low) are “locked in.”
Range‑Width Filter
To avoid false breakouts in low‑volatility mornings, the range must be at least X% of the current price (default 0.35%).
If the measured opening-range width < minimum threshold, no orders are placed that day.
Entry & Order Placement
Long: a stop‑buy order at the opening‑range high.
Short: a stop‑sell order at the opening‑range low.
Only one side can trigger (or both if reverse logic is enabled after a losing trade).
Risk Management
Once triggered, each trade uses an ATR‑style stop-loss defined as a percentage retracement of the range (default 50% of range width).
Profit target is set at a configurable Reward/Risk Ratio (default 1.1×).
Optional: Reverse on Stop‑Loss – if the initial breakout loses, immediately reverse into the opposite side on the same day.
Session Exit
Any open positions are closed at the end of the regular trading day (default 3:45 PM ET window end, with hard flat at session close).
Visual cues are provided via green (range high) and red (range low) step‑line plots directly on the chart, allowing you to see the range box and breakout triggers in real time.
█ Why It Works
Early Momentum Capture: The first 15 – 60 minutes of trading encapsulate overnight news digestion and institutional order flow, creating a well‑defined volatility “range.”
Mechanical Discipline: Clear, rule‑based entries and exits remove emotional guesswork, ensuring consistency.
Volatility Filtering: By requiring a minimum range width, the system avoids choppy, low‑range days where false breakouts are common.
Dynamic Sizing: Stops and targets scale with the opening range, adapting automatically to each day’s volatility environment.
█ How to Use
Set Your Instruments & Timeframe
-Apply to any futures contract on a 1‑ to 5‑minute chart.
-Ensure chart timezone is set to America/New_York.
Configure Inputs
-Opening‑Range Window: e.g. “0930-1015” for a 45‑minute range.
-Min. OR Width (%): e.g. 0.35 for 0.35% of current price.
-Reward/Risk Ratio: e.g. 1.1 for a modest profit target above your stop.
-Max OR Retracement %: e.g. 50 to set stop at 50% of range width.
-One Trade Per Day: toggle to limit to a single breakout.
-Reverse on Stop Loss: toggle to flip direction after a losing breakout.
Monitor the Chart
-Watch the green and red range boundaries form during the session open.
-Orders will automatically submit on the first bar after the range window closes, conditioned on your filters.
Review & Adjust
-Backtest across multiple months to validate performance on your preferred contract.
-Tweak range duration, minimum width, and R/R multiple to fit your risk tolerance and desired win‑rate vs. expectancy balance.
█ Settings Reference
Input Defaults
Opening‑Range Window - Time window to form OR (HHMM-HHMM) - 0930–1015
Regular Trading Day - Full session for EOD flat (HHMM-HHMM) - 0930–1545
Min. OR Width (%) - Minimum OR size as % of close to trigger orders - 0.35
Reward/Risk Ratio - Profit target multiple of stop‑loss distance - 1.1
Max OR Retracement (%) - % of OR width to use as stop‑loss distance - 50
One Trade Per Day - Limit to a single breakout order per day - false
Reverse on Stop Loss - Reverse direction immediately after a losing trade - true
Disclaimer
This strategy description and any accompanying code are provided for educational purposes only and do not constitute financial advice or a solicitation to trade. Futures trading involves substantial risk, including possible loss of capital. Past performance is not indicative of future results. Traders should assess their own risk tolerance and conduct thorough backtesting and forward-testing before committing real capital.

US Index First Candle Breakout with FVGStrategy Description: US Index First Candle Breakout with FVG
Works on NG1! and YM1! for maximised profit.
Overview:
The "US Index First Candle Breakout with FVG" strategy is designed to capitalize on the volatility present during the first minutes of the U.S. stock market opening. By focusing on the initial 5-minute candle, this strategy identifies key price levels that can serve as breakout points for potential trading opportunities.
Key Features:
1. Breakout Strategy:
The strategy tracks the high and low of the first 5-minute candle after the market opens at 9:30 AM (New York time). These levels are critical indicators for potential price movements.
A long position is triggered when the price breaks above the high of the first candle, while a short position is initiated when the price drops below the low.
2. Manual Trade Direction Filter: (developing)
Users can select their preferred trading direction through a customizable input:
Buy only: Execute long trades only.
Sell only: Execute short trades only.
Both: Allow trades in both directions.
This feature enables traders to align the strategy with their market outlook and risk tolerance.
3. Fair Value Gap (FVG) Analysis:
The strategy incorporates an FVG filter to enhance trade precision. It assesses market gaps to identify whether a breakout is supported by underlying market dynamics.
The algorithm checks for conditions that indicate a valid breakout based on previous price action, ensuring that trades are made on strong signals.
4. Risk Management:
A customizable risk per trade setting allows users to define their risk tolerance in ticks.
The strategy includes a reward-to-risk ratio input, enabling traders to set their take-profit levels based on their risk preferences.
Stop-loss levels are automatically calculated based on the breakout direction, helping to safeguard against unexpected price movements.
5. Automatic Trade Execution:
Trades are executed automatically based on the defined conditions, reducing the need for manual intervention and allowing traders to capitalize on market movements in real-time.
Session End Closure:
The strategy automatically closes all open positions at 4:00 PM (New York time), ensuring that trades do not carry overnight risk.
How to Use the Strategy:
Simply add the script to your TradingView chart, set your desired parameters, and select your preferred trade direction.
Monitor for breakout signals during the first trading session, and let the automated system handle trade entries and exits based on your specifications.
Conclusion:
The "US Index First Candle Breakout with FVG" strategy is ideal for traders seeking to leverage early market volatility with a structured approach. By combining breakout techniques with FVG analysis and customizable trade direction, this strategy offers a robust framework for navigating the complexities of the U.S. stock market's opening dynamics.

Baseline TrendBaseline Trend Strategy Overview
Baseline Trend is a crypto-only trading strategy built on straightforward price-based logic: market direction is determined solely by the price’s position relative to a selected baseline open price. No technical indicators like RSI, MACD, or volume are used—this approach is purely focused on price action and position size manipulation.
This strategy is a genuine concept, developed from my own market analysis and logical theory, refined through extensive observation of crypto market behaviour.
While the strategy offers structure and adaptability, it’s important to recognise that no single trading system or indicator fits all market conditions. This tool is meant to support decision-making, not replace it—encouraging traders to stay flexible, informed, and in control of their risk.
Important Usage Note:
This system is intended for crypto markets only.
– When used as an indicator guide, it can be applied to both spot and futures markets.
– However, when used with web-hook automation, it is designed only for futures contracts.
Ensure compatibility with your trading setup before using automation features.
Core Logic: The Baseline
The strategy revolves around the concept of a “Baseline”, with three types available:
Main Baseline: Defines the primary trend direction. If the price is above, go long; if below, go short.
Second Baseline and Third Baseline: Used to measure buying/selling pressure and are key to certain take-profit logic options.
Baselines are customisable to different timeframes—Year, Month, Week, and more—based on available input settings. Structurally, the Main Baseline is the highest-level trend reference, followed by the Second, then Third.
Users can mix and match these baselines across timeframes to backtest crypto symbols and understand behaviour patterns, particularly when used with standard candlestick charts.
Entry & Exit Logic
Entry Signal: Triggered when price crosses over/under a defined distance (percentage) from the Main Baseline. This distance is the Trade Line, calculated based on the close price.
Exit Signal / Stop Loss: If price moves un-favorable and crosses over/under the Stop Loss Line (a defined distance from the Main Baseline), the open position will be force-closed according to user-defined settings.
LiqC (Liquidation Cut)
LiqC is a secondary stop-loss that activates when a leveraged position’s loss equals or exceeds the user-defined liquidation threshold. It forcefully closes the position to help prevent full liquidation before stop-loss, providing an extra layer of protection.
This LiqC is directly tied to the leverage level set by the user. Please ensure you understand how leverage affects liquidation risk, as different broker exchanges may use different liquidation ratio models. Using incorrect assumptions or mismatched leverage values may result in unexpected behaviour.
Position Sizing & Block Units
This strategy features a block-based position sizing system designed for flexibility and precision in trade management:
Block Range: Customisable from 1 to 10 blocks
Risk Allocation: Controlled through a user-defined ROE (Risk of Equity) value
For example, setting an ROE of 0.1% with 10 blocks allocates a total of 1% of account equity to the position. This structure supports both conservative and aggressive risk approaches, depending on user preference.
Block sizes are automatically calculated in alignment with exchange requirements, using Minimum Notional Value (MNV) and Minimum Trade Amount (MTA). These values are dynamically calculated based on the live market price, and scaled relative to the trader’s balance and selected risk percentage. This ensures accurate sizing with built-in adaptability for any account level and current market conditions.
Scalping Meets Trend Holding
This system blends short-term scalping with longer-term trend holding, offering a flexible and adaptive trading style.
Example:
Enter 10 blocks → take quick profits on 5 blocks → let the remaining 5 ride the trend.
This dual-layered approach allows traders to secure early gains while staying positioned for larger market moves. Think of it as:
5 Blocks to Protect: Capture quick wins and manage exposure.
5 Blocks to Pursue: Let profits run by following the broader trend.
By combining both protection and pursuit, the strategy supports risk control without sacrificing the potential for extended returns.
Flexible Take-Profit Logic
The strategy supports multiple, customisable take-profit mechanisms:
TP1–4 (Profit Percentage)
Triggers take profit of 1 block unit when unrealised gains reach defined percentage thresholds (TP1, TP2, TP3, TP4).
Buying/Selling Pressure-Based Take Profit
D1 – Pressure 1
Measures pressure between Second and Third Baselines.
If the distance between them exceeds a user-defined DPT (Decrease Post Threshold) and the price moves far enough from the Third Baseline, D1 activates to take profit or scale out one block.
D2 – Pressure 2
Measures pressure between the Main and Second Baselines.
Works similarly to D1, using a separate distance and pressure trigger.
Note: Both D1 and D2 deactivate in reversal or even trend conditions.
D3–5: High-High / Low-Low Logic
Based on bar index tracking after position entry:
For Long Positions: If after D3 bars the price doesn't exceed the previous bar's high, the system executes a take profit or scale-out.
For Short Positions: If the price doesn't drop below the previous low, the same logic applies.
This approach adds time-based and momentum-aware exit flexibility.
Leverage & Liquidation Risk
When backtesting with leverage enabled, the system checks whether historical candles exceed the liquidation range, calculated based on the average entry price and the leverage input. If the Liquidation Risk Count exceeds 1, profit and loss accuracy may be affected. Traders are encouraged to monitor this count closely to ensure realistic backtesting results.
Since the system cannot directly control or sync with your broker exchange’s actual leverage setting, it’s important to manually match the system’s leverage input with your broker’s configured leverage.
For example: If the system leverage input is set to 10, your exchange leverage setting must also be set to 10. Any mismatch will lead to inaccurate liquidation risk and PnL calculations.
Backtesting and Customisation
All TP1–4 and D1–5 functions are fully optional and customisable. Users are encouraged to backtest different crypto symbols to observe how price behaviour aligns with baseline structures and pressure metrics.
Each of the TP1–4 and D1–5 triggers is designed to execute only once per open position, ensuring controlled and predictable behaviour within each trade cycle.
Since backtesting is based on available historical bar data, please note that data availability varies depending on your TradingView subscription plan. For more reliable insights, it’s recommended to backtest across multiple time ranges, not just the full dataset, to assess the stability and consistency of the strategy’s performance over time.
Additionally, the time frame resolution interval in TradingView is customisable. For best results, use commonly supported time frames such as 30 minutes, 1 hour, 4 hours, 1 day, or 1 week. While the system is designed to support a broad range of intervals, non-standard resolutions may still cause calculation errors.
Currently, the system supports the following resolution ranges:
Intraday: from 1 minute to 720 minutes
(e.g., 60 minutes = 1 hour, 240 minutes = 4 hours, 720 minutes = 12 hours)
Daily: from 1 day to 6 days
Weekly: from 1 week to 3 weeks
Monthly: from 1 month to 4 months
Although the script is built to adapt to various resolutions, users should still monitor output behaviour closely, especially when testing less common or edge-case time frames.
System Usage Notice:
This system can be used as a standalone trading indicator or integrated with an exchange that supports web-hook signal execution. If you choose to automate trades via web-hook, please ensure you fully understand how to configure the setup properly. Web-hook integration methods vary between exchanges, and incorrect setup may lead to unintended trades. Users are responsible for ensuring proper configuration and monitoring of their automation.
Note on Lower Time Frame Usage
When using lower time frames (e.g., 1-minute charts) as the trading time frame, please be aware that available historical data may be limited depending on your subscription plan. This can affect the depth and reliability of backtesting, making it harder to establish a trustworthy probability model for a symbol’s behaviour over time.
Additionally, when pairing a high-level Main Baseline (MBL) time line (such as "1 Month") with low time frame resolutions (like 1-minute), you may encounter order execution limits or calculation overloads during backtesting. This is due to the large number of historical bars required, which can strain the system's capacity.
That said, if a user intentionally chooses to work with lower time frames, that decision is fully respected—but it should be done with awareness and at the user’s own risk.
Things to Be Aware Of (Web-hook Usage Only)
The following points apply if you're using web-hook automation to send signals from the system to an exchange:
Alert Signal Reliability
During extreme market volatility, some broker exchanges may fail to respond to web-hook signals due to traffic overload. While rare, this has occurred in the past and should be considered when relying on automation.
Alert Expiration (TradingView)
If you're on a Basic plan, TradingView alerts are only active for a limited time—typically around 1.5 months. Once expired, signals will no longer be sent out.
To keep your system active, reset the alert before expiration. For uninterrupted alerts, consider upgrading to a Premium plan, which supports permanent alert activation.
TradingView Alert Maintenance
TradingView may occasionally perform system maintenance, during which alerts may temporarily stop functioning. It’s recommended to monitor TradingView’s status if you’re relying on real-time automation.
Repainting
As of the current version, no repainting behaviour has been observed. Signal stability and consistency have been maintained across real-time and historical bars.
Order Execution Type and Fill Logic
All signals use Limit orders by default, except for MBL Exit and Fallback execution, which use Market orders.
Since Limit orders are not guaranteed to fill, the system includes logic to cancel unfilled orders and resend them. If necessary, a Fallback Market order is used to avoid conflict with new incoming trades.
This has only happened once, and is considered rare, but users should always monitor execution status to ensure accuracy and alignment with system behaviour.
Feedback
If you encounter any errors, bugs, or unexpected behaviour while using the system, please don’t hesitate to let me know. Your input is invaluable for helping improve the strategy in future updates.
Likewise, if you have any suggestions or ideas for enhancing the system—whether it’s a new feature, adjustment, or usability improvement—please feel free to share. Together, we can continue refining the tool to make it more robust and beneficial for everyone.
Disclaimer
All trading involves risk, particularly in the crypto market where conditions can be highly volatile. Past performance does not guarantee future outcomes, and market behaviour may evolve over time. This strategy is offered as a tool to support trading decisions and should not be considered financial or investment advice. Each user is responsible for their own actions and accepts full responsibility for any results that may arise from using this system.

Aftershock Playbook: Stock Earnings Drift EngineStrategy type
Event-driven post-earnings momentum engine (long/short) built for single-stock charts or ADRs that publish quarterly results.
What it does
Detects the exact earnings bar (request.earnings, lookahead_off).
Scores the surprise and launches a position on that candle’s close.
Tracks PnL: if the first leg closes green, the engine automatically re-enters on the very next bar, milking residual drift.
Blocks mid-cycle trades after a loss until the next earnings release—keeping the risk contained to one cycle.
Think of it as a sniper that fires on the earnings pop, reloads once if the shot lands, then goes silent until the next report.
Core signal inputs
Component Default Purpose
EPS Surprise % +0 % / –5 % Minimum positive / negative shock to trigger longs/shorts.
Reverse signals? Off Quick flip for mean-reversion experiments.
Time Risk Mgt. Off Optional hard exit after 45 calendar days (auto-scaled to any TF).
Risk engine
ATR-based stop (ATR × 2 by default, editable).
Bar time stop (15-min → Daily: Have to select the bar value ).
No pyramiding beyond the built-in “double-tap”.
All positions sized as % of equity via Strategy Properties.
Visual aids
Yellow triangle marks the earnings bar.
Diagnostics table (top-right) shows last Actual, Estimate, and Surprise %.
Status-line tool-tips on every input.
Default inputs
Setting Value
Positive surprise ≥ 0 %
Negative surprise ≤ –5 %
ATR stop × 2
ATR length 50
Hold horizon 350 ( 1h timeframe chart bars)
Back-test properties
Initial capital 10 000
Order size 5 % of equity
Pyramiding 1 (internal re-entry only)
Commission 0.03 %
Slippage 5 ticks
Fills Bar magnifier ✔ · On bar close ✔ · Standard OHLC ✔
How to use
Add the script to any earnings-driven stock (AAPL, MSFT, TSLA…).
Turn on Time Risk Management if you want stricter risk management
Back-test different ATR multipliers to fit the stock’s volatility.
Sync commission & slippage with your broker before forward-testing.
Important notes
Works on every timeframe from 15 min to 1 D. Sweet spot around 30min/1h
All request.earnings() & request.security() calls use lookahead_off—zero repaint.
The “double-tap” re-entry occurs once per winning cycle to avoid drift-chasing loops.
Historical stats ≠ future performance. Size positions responsibly.

Long/Short/Exit/Risk management Strategy # LongShortExit Strategy Documentation
## Overview
The LongShortExit strategy is a versatile trading system for TradingView that provides complete control over entry, exit, and risk management parameters. It features a sophisticated framework for managing long and short positions with customizable profit targets, stop-loss mechanisms, partial profit-taking, and trailing stops. The strategy can be enhanced with continuous position signals for visual feedback on the current trading state.
## Key Features
### General Settings
- **Trading Direction**: Choose to trade long positions only, short positions only, or both.
- **Max Trades Per Day**: Limit the number of trades per day to prevent overtrading.
- **Bars Between Trades**: Enforce a minimum number of bars between consecutive trades.
### Session Management
- **Session Control**: Restrict trading to specific times of the day.
- **Time Zone**: Specify the time zone for session calculations.
- **Expiration**: Optionally set a date when the strategy should stop executing.
### Contract Settings
- **Contract Type**: Select from common futures contracts (MNQ, MES, NQ, ES) or custom values.
- **Point Value**: Define the dollar value per point movement.
- **Tick Size**: Set the minimum price movement for accurate calculations.
### Visual Signals
- **Continuous Position Signals**: Implement 0 to 1 visual signals to track position states.
- **Signal Plotting**: Customize color and appearance of position signals.
- **Clear Visual Feedback**: Instantly see when entry conditions are triggered.
### Risk Management
#### Stop Loss and Take Profit
- **Risk Type**: Choose between percentage-based, ATR-based, or points-based risk management.
- **Percentage Mode**: Set SL/TP as a percentage of entry price.
- **ATR Mode**: Set SL/TP as a multiple of the Average True Range.
- **Points Mode**: Set SL/TP as a fixed number of points from entry.
#### Advanced Exit Features
- **Break-Even**: Automatically move stop-loss to break-even after reaching specified profit threshold.
- **Trailing Stop**: Implement a trailing stop-loss that follows price movement at a defined distance.
- **Partial Profit Taking**: Take partial profits at predetermined price levels:
- Set first partial exit point and percentage of position to close
- Set second partial exit point and percentage of position to close
- **Time-Based Exit**: Automatically exit a position after a specified number of bars.
#### Win/Loss Streak Management
- **Streak Cutoff**: Automatically pause trading after a series of consecutive wins or losses.
- **Daily Reset**: Option to reset streak counters at the start of each day.
### Entry Conditions
- **Source and Value**: Define the exact price source and value that triggers entries.
- **Equals Condition**: Entry signals occur when the source exactly matches the specified value.
### Performance Analytics
- **Real-Time Stats**: Track important performance metrics like win rate, P&L, and largest wins/losses.
- **Visual Feedback**: On-chart markers for entries, exits, and important events.
### External Integration
- **Webhook Support**: Compatible with TradingView's webhook alerts for automated trading.
- **Cross-Platform**: Connect to external trading systems and notification platforms.
- **Custom Order Execution**: Implement advanced order flows through external services.
## How to Use
### Setup Instructions
1. Add the script to your TradingView chart.
2. Configure the general settings based on your trading preferences.
3. Set session trading hours if you only want to trade specific times.
4. Select your contract specifications or customize for your instrument.
5. Configure risk parameters:
- Choose your preferred risk management approach
- Set appropriate stop-loss and take-profit levels
- Enable advanced features like break-even, trailing stops, or partial profit taking as needed
6. Define entry conditions:
- Select the price source (such as close, open, high, or an indicator)
- Set the specific value that should trigger entries
### Entry Condition Examples
- **Example 1**: To enter when price closes exactly at a whole number:
- Long Source: close
- Long Value: 4200 (for instance, to enter when price closes exactly at 4200)
- **Example 2**: To enter when an indicator reaches a specific value:
- Long Source: ta.rsi(close, 14)
- Long Value: 30 (triggers when RSI equals exactly 30)
### Best Practices
1. **Always backtest thoroughly** before using in live trading.
2. **Start with conservative risk settings**:
- Small position sizes
- Reasonable stop-loss distances
- Limited trades per day
3. **Monitor and adjust**:
- Use the performance table to track results
- Adjust parameters based on how the strategy performs
4. **Consider market volatility**:
- Use ATR-based stops during volatile periods
- Use fixed points during stable markets
## Continuous Position Signals Implementation
The LongShortExit strategy can be enhanced with continuous position signals to provide visual feedback about the current position state. These signals can help you track when the strategy is in a long or short position.
### Adding Continuous Position Signals
Add the following code to implement continuous position signals (0 to 1):
```pine
// Continuous position signals (0 to 1)
var float longSignal = 0.0
var float shortSignal = 0.0
// Update position signals based on your indicator's conditions
longSignal := longCondition ? 1.0 : 0.0
shortSignal := shortCondition ? 1.0 : 0.0
// Plot continuous signals
plot(longSignal, title="Long Signal", color=#00FF00, linewidth=2, transp=0, style=plot.style_line)
plot(shortSignal, title="Short Signal", color=#FF0000, linewidth=2, transp=0, style=plot.style_line)
```
### Benefits of Continuous Position Signals
- Provides clear visual feedback of current position state (long/short)
- Signal values stay consistent (0 or 1) until condition changes
- Can be used for additional calculations or alert conditions
- Makes it easier to track when entry conditions are triggered
### Using with Custom Indicators
You can adapt the continuous position signals to work with any custom indicator by replacing the condition with your indicator's logic:
```pine
// Example with moving average crossover
longSignal := fastMA > slowMA ? 1.0 : 0.0
shortSignal := fastMA < slowMA ? 1.0 : 0.0
```
## Webhook Integration
The LongShortExit strategy is fully compatible with TradingView's webhook alerts, allowing you to connect your strategy to external trading platforms, brokers, or custom applications for automated trading execution.
### Setting Up Webhooks
1. Create an alert on your chart with the LongShortExit strategy
2. Enable the "Webhook URL" option in the alert dialog
3. Enter your webhook endpoint URL (from your broker or custom trading system)
4. Customize the alert message with relevant information using TradingView variables
### Webhook Message Format Example
```json
{
"strategy": "LongShortExit",
"action": "{{strategy.order.action}}",
"price": "{{strategy.order.price}}",
"quantity": "{{strategy.position_size}}",
"time": "{{time}}",
"ticker": "{{ticker}}",
"position_size": "{{strategy.position_size}}",
"position_value": "{{strategy.position_value}}",
"order_id": "{{strategy.order.id}}",
"order_comment": "{{strategy.order.comment}}"
}
```
### TradingView Alert Condition Examples
For effective webhook automation, set up these alert conditions:
#### Entry Alert
```
{{strategy.position_size}} != {{strategy.position_size}}
```
#### Exit Alert
```
{{strategy.position_size}} < {{strategy.position_size}} or {{strategy.position_size}} > {{strategy.position_size}}
```
#### Partial Take Profit Alert
```
strategy.order.comment contains "Partial TP"
```
### Benefits of Webhook Integration
- **Automated Trading**: Execute trades automatically through supported brokers
- **Cross-Platform**: Connect to custom trading bots and applications
- **Real-Time Notifications**: Receive trade signals on external platforms
- **Data Collection**: Log trade data for further analysis
- **Custom Order Management**: Implement advanced order types not available in TradingView
### Compatible External Applications
- Trading bots and algorithmic trading software
- Custom order execution systems
- Discord, Telegram, or Slack notification systems
- Trade journaling applications
- Risk management platforms
### Implementation Recommendations
- Test webhook delivery using a free service like webhook.site before connecting to your actual trading system
- Include authentication tokens or API keys in your webhook URL or payload when required by your external service
- Consider implementing confirmation mechanisms to verify trade execution
- Log all webhook activities for troubleshooting and performance tracking
## Strategy Customization Tips
### For Scalping
- Set smaller profit targets (1-3 points)
- Use tighter stop-losses
- Enable break-even feature after small profit
- Set higher max trades per day
### For Day Trading
- Use moderate profit targets
- Implement partial profit taking
- Enable trailing stops
- Set reasonable session trading hours
### For Swing Trading
- Use longer-term charts
- Set wider stops (ATR-based often works well)
- Use higher profit targets
- Disable daily streak reset
## Common Troubleshooting
### Low Win Rate
- Consider widening stop-losses
- Verify that entry conditions aren't triggering too frequently
- Check if the equals condition is too restrictive; consider small tolerances
### Missing Obvious Trades
- The equals condition is extremely precise. Price must exactly match the specified value.
- Consider using floating-point precision for more reliable triggers
### Frequent Stop-Outs
- Try ATR-based stops instead of fixed points
- Increase the stop-loss distance
- Enable break-even feature to protect profits
## Important Notes
- The exact equals condition is strict and may result in fewer trade signals compared to other conditions.
- For instruments with decimal prices, exact equality might be rare. Consider the precision of your value.
- Break-even and trailing stop calculations are based on points, not percentage.
- Partial take-profit levels are defined in points distance from entry.
- The continuous position signals (0 to 1) provide valuable visual feedback but don't affect the strategy's trading logic directly.
- When implementing continuous signals, ensure they're aligned with the actual entry conditions used by the strategy.
---
*This strategy is for educational and informational purposes only. Always test thoroughly before using with real funds.*

MÈGAS ALGO : MÈGAS Engine [STRATEGY]Overview
The MÈGAS Engine is an advanced algorithmic trading system that integrates a range of technical analysis tools to pinpoint high-probability opportunities in the market.
Key Features
Core Signal Generation:
-Structure Break Detection: Advanced breakout identification with adjustable
sensitivity controls
-Dual-Direction Analysis: Separate bullish and bearish signal parameters with customizable delta
thresholds and depth settings
-Dynamic Parameter Management: OverfitShield technology with pulsewave parameter cycling
to reduce overfitting risks
Filtering Alghoritm:
-Volatility Filter: Rogers-Satchell volatility estimation with RSI-based normalization to avoid
trading in unfavorable market conditions
-Volume Confirmation: Cumulative volume analysis ensuring adequate liquidity support for trade
entries
OverfitShield Method:
OverfitShield is a built-in function within the trading strategy designed to reduce overfitting bias by introducing parameter variability during execution. When the "variable" mode is activated, instead of relying on fixed values for key strategy parameters the system dynamically selects values from customizable ranges.
This approach mimics real-world market uncertainty and ensures that the strategy does not become overly dependent on a single optimal value found during backtesting — making it more robust across different market conditions and time periods.
Position Management
-Customizable Exit Set-up
The exit logic can be customized to 'CONTINUE', 'TAKE PROFIT', or 'TRAILING PROFIT' to suit
your trading approach and maximize performance.
-CONTINUE Mode:
This mode does not use predefined take profit levels. Instead, it remains in the market as long as the trend persists. By avoiding fixed exit points, this approach is often the most effective in backtesting, as it allows positions to run in favorable trends for longer periods.
-TAKE PROFIT Mode:
This mode allows you to set multiple grid-like take profit levels at different price points, effectively creating a multi-tier exit strategy. You can specify the number of profit levels you want, along with the percentage step between each level. This structured approach can be beneficial for capturing incremental profits in a trending market while allowing for more flexibility in trade management.
-TRAILING PROFIT Mode:
Similar to the Take Profit mode, this option allows you to set the trailing stop levels. The trailing stop moves with the market, ensuring that you lock in profits as the price continues to move in your favor. Once a profit level is hit, the trailing stop "follows" the price movement, adjusting dynamically to safeguard profits as the trade progresses.
3. Customizable Insight Alerts
Traders can configure personalized alert messages for every strategy action, including entries, exits, and profit targets. These alerts are fully compatible with TradingView's webhook system.
Advantages
Customization: Fully customizable exit set-up and alerts allow traders to tailor the strategy to their personal trading objectives.
How It Works — Step by Step
Step 1: Apply the Strategy
Open the chart for your selected symbol and timeframe. Add the MÈGAS Engine to the chart.
Step 2:Backtesting and Optimization
Run a full backtest and optimize the strategy parameters across the chosen trading pairs to:
Identify robust settings that perform consistently well
Avoid overfitting through validation techniques
Select the most profitable and stable configuration for live or forward testing.
Step 3: Review Results and Alerts
Check the backtest results on the chart and confirm that the custom alert messages are displaying as expected. This helps verify that everything is functioning correctly before moving forward.
Step 4: Configure Portfolio Management
Set up the exit logic based on your specific requirements. Tailor the exit strategy to match your trading approach, whether you prefer predefined take profit levels, trailing stops, or a trend-following method. This flexibility ensures the exit logic aligns with your overall strategy for optimal performance.
Open the strategy settings window. In the dedicated portfolio management section, choose your preferred capital allocation method based on your trading style and risk preferences. Once set, save the configuration as the default.
Step 5: Set Up Alerts
Click "Add Alert" on the strategy
-In the message field, use: {{strategy.order.comment}}
Under the Notifications tab:
-Enable Webhook URL
-Enter your external webhook address
-Click 'Create' to activate alerts for your strategy
Please Note:
The results and visualizations presented are derived from optimized backtesting iterations using historical and paid real-time market data sourced via TradingView. While these results are intended to demonstrate potential performance, they do not guarantee future outcomes or accuracy. Past performance is not indicative of future results, and all trading involves risk.
We strongly recommend that users review and adjust the Properties within the script settings to align with their specific account configurations and preferred trading platforms. This ensures that the strategy outputs are reflective of real-world conditions and enhances the reliability of the results obtained. Use this tool responsibly and at your own risk.

Grid TLong V1The “Grid TLong V1” strategy is based on the classic Grid strategy, but in the mode of buying and selling in favor of the trend and only on Long. This allows to take advantage of large uptrend movements to maximize profits in bull markets. For this reason, excessively sideways or bearish markets may not be very conducive to this strategy.
Like our Grid strategies in favor of the trend, you can enter and exit with the balance with controlled risk, as the distance between each grid functions as a natural and adaptable stop loss and take profit. What differentiates it from bidirectional strategies is that Short uses a minimum amount of follow-through, so that the percentage distance between the grids is maintained.
In this version of the script the entries and exits can be chosen at market or limit , and are based on the profit or loss of the current position, not on the percentage change in price.
The user may also notice that the strategy setup is risk-controlled, because it risks 5% on each trade, has a fairly standard commission and modest initial capital, all in order to protect the strategy user from unrealistic results.
As with all strategies, it is strongly recommended to optimize the parameters for the strategy to be effective for each asset and for each time frame.

Grid Tendence V1The “Grid Tendence V1” strategy is based on the classic Grid strategy, only in this case the entries and exits are made in favor of the trend, which allows to take advantage of large movements to maximize profits, since it is also possible to enter and exit with the balance with a controlled risk, because precisely the distance between each Grid works as a natural and adaptable stop loss and take profit. This fact helps to avoid overlapping entries and exits that would result from using stop loss and take profit as limit orders.
In this version of the script the entries and exits are always at market, and based on the percentage change of the price, not on the profit or loss of the current position.
The user will notice that the strategy setup is based on a controlled risk, risking 5% on each trade, a fairly standard commission and a modest initial capital, all this in order to protect the user of the strategy from unexpected or unrealistic results.
However, it is always recommended to optimize the parameters so that the strategy is effective for each asset and for each time frame.

Supertrend - SSL Strategy with Toggle [AlPashaTrader]📈 Overview of the Supertrend - SSL Strategy with Toggle Indicator
This strategy combines two powerful technical tools—Supertrend and SSL Channel—to deliver precise and reliable trading signals, designed for traders who value confirmation and risk management. 🎯
⚙️ How This Indicator Was Created
The strategy was meticulously crafted to harness the complementary strengths of:
Supertrend Indicator: A trend-following tool based on Average True Range (ATR) and a multiplier factor, it detects bullish or bearish trends by calculating dynamic support and resistance levels. 📊
SSL Channel: A channel indicator built using two Simple Moving Averages (SMA) of the highs and lows over a set period. It cleverly determines trend direction by comparing price action relative to these moving averages. 🔄
These two indicators are merged into one cohesive strategy with an optional toggle feature allowing the trader to choose whether to require confirmation from both indicators before taking a position or to act on signals from either. 🎚️
The script includes user-friendly controls for:
Defining a custom trading date range 📅, useful for backtesting or restricting trading to specific market conditions.
Setting the ATR length and multiplier for Supertrend sensitivity ⚙️.
Adjusting the SSL channel period for responsiveness to price changes ⏱️.
Choosing whether to require dual confirmation (both Supertrend and SSL signals) for more conservative trading or a single indicator trigger for a more aggressive approach 🛡️ vs ⚔️.
🔍 How This Indicator Works
Signal Generation:
Supertrend analyzes market volatility and trend direction, signaling a potential buy when the trend turns bullish 📈 and a sell when bearish 📉.
SSL Channel tracks price relative to its high and low moving averages to identify uptrends and downtrends. A crossover of the SSL Up and SSL Down lines generates buy or sell signals 🔔.
Confirmation Logic:
When confirmation is enabled, the strategy waits for agreement between both indicators before entering a trade ✅, reducing false signals.
When confirmation is disabled, it trades based on signals from either indicator ⚡, allowing more frequent entries but potentially higher risk.
Entry and Exit Rules:
Entry occurs when the indicator(s) signal a new trend direction 🚀 for long, or decline for short.
Exit happens when opposing signals appear 🛑, closing existing positions to lock in profits or cut losses.
Visual Aids:
The SSL Channel lines are plotted directly on the chart with distinct colors to intuitively show trend shifts 🎨.
The system respects the specified date range ⏳, ensuring trades only occur within user-defined periods.
🎯 How to Use This Strategy Effectively
Set Your Preferences: Adjust ATR length, factor, and SSL period to your style. More sensitive? Decrease lengths. Smoother? Increase them ⚙️.
Choose Confirmation Mode: Use the toggle depending on your risk appetite:
Confirmation ON ✅: For conservative traders wanting high-probability setups.
Confirmation OFF ⚡: For aggressive traders who want more signals.
Apply Date Filters: Focus your trading or backtesting on specific periods 📅.
Monitor Entry/Exit Signals: Watch crossovers and Supertrend changes closely 👀.
Risk Management: The strategy uses position sizing as a percentage of equity (default 15%) 💰. Adjust accordingly.
Combine with Other Tools: Enhance results by combining this with volume, price action, or fundamentals 🔧.
📝 Summary
This Supertrend - SSL Strategy with Toggle is a dynamic and flexible trading tool blending volatility-based trend detection with moving-average channel insights. It empowers traders to customize confirmation strictness, control trading periods, and efficiently capture trending opportunities while managing risk smartly.
By integrating proven indicators in a user-friendly, visually intuitive package, this strategy stands as a sophisticated tool suitable for various markets and trading styles. 🚀📊

Breakout Core | by Solid#SignalsBreakout Core | by SolidSignals
General Overview
Breakout Core is an advanced breakout trading strategy designed for Bitcoin (BTC). Optimized for the unique market dynamics following the launch of BlackRock’s Spot ETFs in January 2024, it adapts to Bitcoin’s post-ETF volatility patterns. The strategy’s core strength lies in its low drawdown, achieved through a proprietary time-based signal-filtering algorithm that sets it apart from traditional breakout strategies. Breakout Core offers traders a reliable tool for navigating Bitcoin’s evolving market with reduced risk and enhanced precision.
Mechanisms
Breakout Core combines well-known indicators BB, EMAs, MAs with custom-tuned parameters to improve signal accuracy. Its unique feature is a proprietary time-filter algorithm that prioritizes high-probability breakout signals during specific high-volatility trading hours, derived from market analysis post-ETF launch. This algorithm minimizes false positives, particularly in volatile conditions, by integrating time-based volatility patterns with price action. The result is a robust strategy that optimizes entry and exit points for Bitcoin trading.
Objectives
Breakout Core aims to provide steady returns with controlled risk by targeting Bitcoin’s breakout patterns in the post-ETF market. Its low drawdown, achieved through extensive optimization and proprietary logic, makes it suitable for leverage trading (e.g., 3–5x leverage), balancing growth with capital protection. Tailored for BTC, the strategy equips traders with a precise tool to navigate Bitcoin’s transformed market dynamics.
Backtesting and Parameter Notes
Backtesting was performed using a $10,000 USDT account, risking up to 10% of equity per trade, including 0.06% commission fees and 2-tick slippage, aligned with standard exchange conditions. The strategy report details backtesting results from the launch of BlackRock’s Spot ETFs. These settings are the script’s defaults, ensuring transparency. Traders are encouraged to verify results using TradingView’s Deep Backtest feature to adapt to current market conditions.
Please note: Past performance does not guarantee future results.
Chart and Usage
The chart is clean and intuitive, displaying only Breakout Core’s buy and sell signals for easy interpretation. Parameters are pre-optimized for immediate use, with adjustable Take Profit (TP) and Stop Loss (SL) levels. Traders should validate custom settings via TradingView’s backtesting tools to ensure market compatibility. An integrated Alarm Panel supports API connectivity, providing clear Entry/Exit commands for Long and Short positions, enabling seamless automated trading workflows.
Originality Statement
Breakout Core is an original strategy developed by SolidSignals, leveraging standard indicators (Bollinger Bands, EMAs, MAs) combined with a proprietary time-filter algorithm. No third-party or open-source code is used, ensuring full compliance with TradingView’s originality requirements. The time-filter mechanism, based on post-ETF volatility analysis, distinguishes this strategy from conventional breakout approaches.
Important Disclaimer
Market conditions evolve continuously, and past performance is not indicative of future results. Traders are responsible for validating the strategy’s settings and performance under current market conditions before use.

Bober XM v2.0# ₿ober XM v2.0 Trading Bot Documentation
**Developer's Note**: While our previous Bot 1.3.1 was removed due to guideline violations, this setback only fueled our determination to create something even better. Rising from this challenge, Bober XM 2.0 emerges not just as an update, but as a complete reimagining with multi-timeframe analysis, enhanced filters, and superior adaptability. This adversity pushed us to innovate further and deliver a strategy that's smarter, more agile, and more powerful than ever before. Challenges create opportunity - welcome to Cryptobeat's finest work yet.
## !!!!You need to tune it for your own pair and timeframe and retune it periodicaly!!!!!
## Overview
The ₿ober XM v2.0 is an advanced dual-channel trading bot with multi-timeframe analysis capabilities. It integrates multiple technical indicators, customizable risk management, and advanced order execution via webhook for automated trading. The bot's distinctive feature is its separate channel systems for long and short positions, allowing for asymmetric trade strategies that adapt to different market conditions across multiple timeframes.
### Key Features
- **Multi-Timeframe Analysis**: Analyze price data across multiple timeframes simultaneously
- **Dual Channel System**: Separate parameter sets for long and short positions
- **Advanced Entry Filters**: RSI, Volatility, Volume, Bollinger Bands, and KEMAD filters
- **Machine Learning Moving Average**: Adaptive prediction-based channels
- **Multiple Entry Strategies**: Breakout, Pullback, and Mean Reversion modes
- **Risk Management**: Customizable stop-loss, take-profit, and trailing stop settings
- **Webhook Integration**: Compatible with external trading bots and platforms
### Strategy Components
| Component | Description |
|---------|-------------|
| **Dual Channel Trading** | Uses either Keltner Channels or Machine Learning Moving Average (MLMA) with separate settings for long and short positions |
| **MLMA Implementation** | Machine learning algorithm that predicts future price movements and creates adaptive bands |
| **Pivot Point SuperTrend** | Trend identification and confirmation system based on pivot points |
| **Three Entry Strategies** | Choose between Breakout, Pullback, or Mean Reversion approaches |
| **Advanced Filter System** | Multiple customizable filters with multi-timeframe support to avoid false signals |
| **Custom Exit Logic** | Exits based on OBV crossover of its moving average combined with pivot trend changes |
### Note for Novice Users
This is a fully featured real trading bot and can be tweaked for any ticker — SOL is just an example. It follows this structure:
1. **Indicator** – gives the initial signal
2. **Entry strategy** – decides when to open a trade
3. **Exit strategy** – defines when to close it
4. **Trend confirmation** – ensures the trade follows the market direction
5. **Filters** – cuts out noise and avoids weak setups
6. **Risk management** – controls losses and protects your capital
To tune it for a different pair, you'll need to start from scratch:
1. Select the timeframe (candle size)
2. Turn off all filters and trend entry/exit confirmations
3. Choose a channel type, channel source and entry strategy
4. Adjust risk parameters
5. Tune long and short settings for the channel
6. Fine-tune the Pivot Point Supertrend and Main Exit condition OBV
This will generate a lot of signals and activity on the chart. Your next task is to find the right combination of filters and settings to reduce noise and tune it for profitability.
### Default Strategy values
Default values are tuned for: Symbol BITGET:SOLUSDT.P 5min candle
Filters are off by default: Try to play with it to understand how it works
## Configuration Guide
### General Settings
| Setting | Description | Default Value |
|---------|-------------|---------------|
| **Long Positions** | Enable or disable long trades | Enabled |
| **Short Positions** | Enable or disable short trades | Enabled |
| **Risk/Reward Area** | Visual display of stop-loss and take-profit zones | Enabled |
| **Long Entry Source** | Price data used for long entry signals | hl2 (High+Low/2) |
| **Short Entry Source** | Price data used for short entry signals | hl2 (High+Low/2) |
The bot allows you to trade long positions, short positions, or both simultaneously. Each direction has its own set of parameters, allowing for fine-tuned strategies that recognize the asymmetric nature of market movements.
### Multi-Timeframe Settings
1. **Enable Multi-Timeframe Analysis**: Toggle 'Enable Multi-Timeframe Analysis' in the Multi-Timeframe Settings section
2. **Configure Timeframes**: Set appropriate higher timeframes based on your trading style:
- Timeframe 1: Default is now 15 minutes (intraday confirmation)
- Timeframe 2: Default is 4 hours (trend direction)
3. **Select Sources per Indicator**: For each indicator (RSI, KEMAD, Volume, etc.), choose:
- The desired timeframe (current, mtf1, or mtf2)
- The appropriate price type (open, high, low, close, hl2, hlc3, ohlc4)
### Entry Strategies
- **Breakout**: Enter when price breaks above/below the channel
- **Pullback**: Enter when price pulls back to the channel
- **Mean Reversion**: Enter when price is extended from the channel
You can enable different strategies for long and short positions.
### Core Components
### Risk Management
- **Position Size**: Control risk with percentage-based position sizing
- **Stop Loss Options**:
- Fixed: Set a specific price or percentage from entry
- ATR-based: Dynamic stop-loss based on market volatility
- Swing: Uses recent swing high/low points
- **Take Profit**: Multiple targets with percentage allocation
- **Trailing Stop**: Dynamic stop that follows price movement
## Advanced Usage Strategies
### Moving Average Type Selection Guide
- **SMA**: More stable in choppy markets, good for higher timeframes
- **EMA/WMA**: More responsive to recent price changes, better for entry signals
- **VWMA**: Adds volume weighting for stronger trends, use with Volume filter
- **HMA**: Balance between responsiveness and noise reduction, good for volatile markets
### Multi-Timeframe Strategy Approaches
- **Trend Confirmation**: Use higher timeframe RSI (mtf2) for overall trend, current timeframe for entries
- **Entry Precision**: Use KEMAD on current timeframe with volume filter on mtf1
- **False Signal Reduction**: Apply RSI filter on mtf1 with strict KEMAD settings
### Market Condition Optimization
| Market Condition | Recommended Settings |
|------------------|----------------------|
| **Trending** | Use Breakout strategy with KEMAD filter on higher timeframe |
| **Ranging** | Use Mean Reversion with strict RSI filter (mtf1) |
| **Volatile** | Increase ATR multipliers, use HMA for moving averages |
| **Low Volatility** | Decrease noise parameters, use pullback strategy |
## Webhook Integration
The strategy features a professional webhook system that allows direct connectivity to your exchange or trading platform of choice through third-party services like 3commas, Alertatron, or Autoview.
The webhook payload includes all necessary parameters for automated execution:
- Entry price and direction
- Stop loss and take profit levels
- Position size
- Custom identifier for webhook routing
## Performance Optimization Tips
1. **Start with Defaults**: Begin with the default settings for your timeframe before customizing
2. **Adjust One Component at a Time**: Make incremental changes and test the impact
3. **Match MA Types to Market Conditions**: Use appropriate moving average types based on the Market Condition Optimization table
4. **Timeframe Synergy**: Create logical relationships between timeframes (e.g., 5min chart with 15min and 4h higher timeframes)
5. **Periodic Retuning**: Markets evolve - regularly review and adjust parameters
## Common Setups
### Crypto Trend-Following
- MLMA with EMA or HMA
- Higher RSI thresholds (75/25)
- KEMAD filter on mtf1
- Breakout entry strategy
### Stock Swing Trading
- MLMA with SMA for stability
- Volume filter with higher threshold
- KEMAD with increased filter order
- Pullback entry strategy
### Forex Scalping
- MLMA with WMA and lower noise parameter
- RSI filter on current timeframe
- Use highest timeframe for trend direction only
- Mean Reversion strategy
## Webhook Configuration
- **Benefits**:
- Automated trade execution without manual intervention
- Immediate response to market conditions
- Consistent execution of your strategy
- **Implementation Notes**:
- Requires proper webhook configuration on your exchange or platform
- Test thoroughly with small position sizes before full deployment
- Consider latency between signal generation and execution
### Backtesting Period
Define a specific historical period to evaluate the bot's performance:
| Setting | Description | Default Value |
|---------|-------------|---------------|
| **Start Date** | Beginning of backtest period | January 1, 2025 |
| **End Date** | End of backtest period | December 31, 2026 |
- **Best Practice**: Test across different market conditions (bull markets, bear markets, sideways markets)
- **Limitation**: Past performance doesn't guarantee future results
## Entry and Exit Strategies
### Dual-Channel System
A key innovation of the Bober XM is its dual-channel approach:
- **Independent Parameters**: Each trade direction has its own channel settings
- **Asymmetric Trading**: Recognizes that markets often behave differently in uptrends versus downtrends
- **Optimized Performance**: Fine-tune settings for both bullish and bearish conditions
This approach allows the bot to adapt to the natural asymmetry of markets, where uptrends often develop gradually while downtrends can be sharp and sudden.
### Channel Types
#### 1. Keltner Channels
Traditional volatility-based channels using EMA and ATR:
| Setting | Long Default | Short Default |
|---------|--------------|---------------|
| **EMA Length** | 37 | 20 |
| **ATR Length** | 13 | 17 |
| **Multiplier** | 1.4 | 1.9 |
| **Source** | low | high |
- **Strengths**:
- Reliable in trending markets
- Less prone to whipsaws than Bollinger Bands
- Clear visual representation of volatility
- **Weaknesses**:
- Can lag during rapid market changes
- Less effective in choppy, non-trending markets
#### 2. Machine Learning Moving Average (MLMA)
Advanced predictive model using kernel regression (RBF kernel):
| Setting | Description | Options |
|---------|-------------|--------|
| **Source MA** | Price data used for MA calculations | Any price source (low/high/close/etc.) |
| **Moving Average Type** | Type of MA algorithm for calculations | SMA, EMA, WMA, VWMA, RMA, HMA |
| **Trend Source** | Price data used for trend determination | Any price source (close default) |
| **Window Size** | Historical window for MLMA calculations | 5+ (default: 16) |
| **Forecast Length** | Number of bars to forecast ahead | 1+ (default: 3) |
| **Noise Parameter** | Controls smoothness of prediction | 0.01+ (default: ~0.43) |
| **Band Multiplier** | Multiplier for channel width | 0.1+ (default: 0.5-0.6) |
- **Strengths**:
- Predictive rather than reactive
- Adapts quickly to changing market conditions
- Better at identifying trend reversals early
- **Weaknesses**:
- More computationally intensive
- Requires careful parameter tuning
- Can be sensitive to input data quality
### Entry Strategies
| Strategy | Description | Ideal Market Conditions |
|----------|-------------|-------------------------|
| **Breakout** | Enters when price breaks through channel bands, indicating strong momentum | High volatility, emerging trends |
| **Pullback** | Enters when price retraces to the middle band after testing extremes | Established trends with regular pullbacks |
| **Mean Reversion** | Enters at channel extremes, betting on a return to the mean | Range-bound or oscillating markets |
#### Breakout Strategy (Default)
- **Implementation**: Enters long when price crosses above the upper band, short when price crosses below the lower band
- **Strengths**: Captures strong momentum moves, performs well in trending markets
- **Weaknesses**: Can lead to late entries, higher risk of false breakouts
- **Optimization Tips**:
- Increase channel multiplier for fewer but more reliable signals
- Combine with volume confirmation for better accuracy
#### Pullback Strategy
- **Implementation**: Enters long when price pulls back to middle band during uptrend, short during downtrend pullbacks
- **Strengths**: Better entry prices, lower risk, higher probability setups
- **Weaknesses**: Misses some strong moves, requires clear trend identification
- **Optimization Tips**:
- Use with trend filters to confirm overall direction
- Adjust middle band calculation for market volatility
#### Mean Reversion Strategy
- **Implementation**: Enters long at lower band, short at upper band, expecting price to revert to the mean
- **Strengths**: Excellent entry prices, works well in ranging markets
- **Weaknesses**: Dangerous in strong trends, can lead to fighting the trend
- **Optimization Tips**:
- Implement strong trend filters to avoid counter-trend trades
- Use smaller position sizes due to higher risk nature
### Confirmation Indicators
#### Pivot Point SuperTrend
Combines pivot points with ATR-based SuperTrend for trend confirmation:
| Setting | Default Value |
|---------|---------------|
| **Pivot Period** | 25 |
| **ATR Factor** | 2.2 |
| **ATR Period** | 41 |
- **Function**: Identifies significant market turning points and confirms trend direction
- **Implementation**: Requires price to respect the SuperTrend line for trade confirmation
#### Weighted Moving Average (WMA)
Provides additional confirmation layer for entries:
| Setting | Default Value |
|---------|---------------|
| **Period** | 15 |
| **Source** | ohlc4 (average of Open, High, Low, Close) |
- **Function**: Confirms trend direction and filters out low-quality signals
- **Implementation**: Price must be above WMA for longs, below for shorts
### Exit Strategies
#### On-Balance Volume (OBV) Based Exits
Uses volume flow to identify potential reversals:
| Setting | Default Value |
|---------|---------------|
| **Source** | ohlc4 |
| **MA Type** | HMA (Options: SMA, EMA, WMA, RMA, VWMA, HMA) |
| **Period** | 22 |
- **Function**: Identifies divergences between price and volume to exit before reversals
- **Implementation**: Exits when OBV crosses its moving average in the opposite direction
- **Customizable MA Type**: Different MA types provide varying sensitivity to OBV changes:
- **SMA**: Traditional simple average, equal weight to all periods
- **EMA**: More weight to recent data, responds faster to price changes
- **WMA**: Weighted by recency, smoother than EMA
- **RMA**: Similar to EMA but smoother, reduces noise
- **VWMA**: Factors in volume, helpful for OBV confirmation
- **HMA**: Reduces lag while maintaining smoothness (default)
#### ADX Exit Confirmation
Uses Average Directional Index to confirm trend exhaustion:
| Setting | Default Value |
|---------|---------------|
| **ADX Threshold** | 35 |
| **ADX Smoothing** | 60 |
| **DI Length** | 60 |
- **Function**: Confirms trend weakness before exiting positions
- **Implementation**: Requires ADX to drop below threshold or DI lines to cross
## Filter System
### RSI Filter
- **Function**: Controls entries based on momentum conditions
- **Parameters**:
- Period: 15 (default)
- Overbought level: 71
- Oversold level: 23
- Multi-timeframe support: Current, MTF1 (15min), or MTF2 (4h)
- Customizable price source (open, high, low, close, hl2, hlc3, ohlc4)
- **Implementation**: Blocks long entries when RSI > overbought, short entries when RSI < oversold
### Volatility Filter
- **Function**: Prevents trading during excessive market volatility
- **Parameters**:
- Measure: ATR (Average True Range)
- Period: Customizable (default varies by timeframe)
- Threshold: Adjustable multiplier
- Multi-timeframe support
- Customizable price source
- **Implementation**: Blocks trades when current volatility exceeds threshold × average volatility
### Volume Filter
- **Function**: Ensures adequate market liquidity for trades
- **Parameters**:
- Threshold: 0.4× average (default)
- Measurement period: 5 (default)
- Moving average type: Customizable (HMA default)
- Multi-timeframe support
- Customizable price source
- **Implementation**: Requires current volume to exceed threshold × average volume
### Bollinger Bands Filter
- **Function**: Controls entries based on price relative to statistical boundaries
- **Parameters**:
- Period: Customizable
- Standard deviation multiplier: Adjustable
- Moving average type: Customizable
- Multi-timeframe support
- Customizable price source
- **Implementation**: Can require price to be within bands or breaking out of bands depending on strategy
### KEMAD Filter (Kalman EMA Distance)
- **Function**: Advanced trend confirmation using Kalman filter algorithm
- **Parameters**:
- Process Noise: 0.35 (controls smoothness)
- Measurement Noise: 24 (controls reactivity)
- Filter Order: 6 (higher = more smoothing)
- ATR Length: 8 (for bandwidth calculation)
- Upper Multiplier: 2.0 (for long signals)
- Lower Multiplier: 2.7 (for short signals)
- Multi-timeframe support
- Customizable visual indicators
- **Implementation**: Generates signals based on price position relative to Kalman-filtered EMA bands
## Risk Management System
### Position Sizing
Automatically calculates position size based on account equity and risk parameters:
| Setting | Default Value |
|---------|---------------|
| **Risk % of Equity** | 50% |
- **Implementation**:
- Position size = (Account equity × Risk %) ÷ (Entry price × Stop loss distance)
- Adjusts automatically based on volatility and stop placement
- **Best Practices**:
- Start with lower risk percentages (1-2%) until strategy is proven
- Consider reducing risk during high volatility periods
### Stop-Loss Methods
Multiple stop-loss calculation methods with separate configurations for long and short positions:
| Method | Description | Configuration |
|--------|-------------|---------------|
| **ATR-Based** | Dynamic stops based on volatility | ATR Period: 14, Multiplier: 2.0 |
| **Percentage** | Fixed percentage from entry | Long: 1.5%, Short: 1.5% |
| **PIP-Based** | Fixed currency unit distance | 10.0 pips |
- **Implementation Notes**:
- ATR-based stops adapt to changing market volatility
- Percentage stops maintain consistent risk exposure
- PIP-based stops provide precise control in stable markets
### Trailing Stops
Locks in profits by adjusting stop-loss levels as price moves favorably:
| Setting | Default Value |
|---------|---------------|
| **Stop-Loss %** | 1.5% |
| **Activation Threshold** | 2.1% |
| **Trailing Distance** | 1.4% |
- **Implementation**:
- Initial stop remains fixed until profit reaches activation threshold
- Once activated, stop follows price at specified distance
- Locks in profit while allowing room for normal price fluctuations
### Risk-Reward Parameters
Defines the relationship between risk and potential reward:
| Setting | Default Value |
|---------|---------------|
| **Risk-Reward Ratio** | 1.4 |
| **Take Profit %** | 2.4% |
| **Stop-Loss %** | 1.5% |
- **Implementation**:
- Take profit distance = Stop loss distance × Risk-reward ratio
- Higher ratios require fewer winning trades for profitability
- Lower ratios increase win rate but reduce average profit
### Filter Combinations
The strategy allows for simultaneous application of multiple filters:
- **Recommended Combinations**:
- Trending markets: RSI + KEMAD filters
- Ranging markets: Bollinger Bands + Volatility filters
- All markets: Volume filter as minimum requirement
- **Performance Impact**:
- Each additional filter reduces the number of trades
- Quality of remaining trades typically improves
- Optimal combination depends on market conditions and timeframe
### Multi-Timeframe Filter Applications
| Filter Type | Current Timeframe | MTF1 (15min) | MTF2 (4h) |
|-------------|-------------------|-------------|------------|
| RSI | Quick entries/exits | Intraday trend | Overall trend |
| Volume | Immediate liquidity | Sustained support | Market participation |
| Volatility | Entry timing | Short-term risk | Regime changes |
| KEMAD | Precise signals | Trend confirmation | Major reversals |
## Visual Indicators and Chart Analysis
The bot provides comprehensive visual feedback on the chart:
- **Channel Bands**: Keltner or MLMA bands showing potential support/resistance
- **Pivot SuperTrend**: Colored line showing trend direction and potential reversal points
- **Entry/Exit Markers**: Annotations showing actual trade entries and exits
- **Risk/Reward Zones**: Visual representation of stop-loss and take-profit levels
These visual elements allow for:
- Real-time strategy assessment
- Post-trade analysis and optimization
- Educational understanding of the strategy logic
## Implementation Guide
### TradingView Setup
1. Load the script in TradingView Pine Editor
2. Apply to your preferred chart and timeframe
3. Adjust parameters based on your trading preferences
4. Enable alerts for webhook integration
### Webhook Integration
1. Configure webhook URL in TradingView alerts
2. Set up receiving endpoint on your trading platform
3. Define message format matching the bot's output
4. Test with small position sizes before full deployment
### Optimization Process
1. Backtest across different market conditions
2. Identify parameter sensitivity through multiple tests
3. Focus on risk management parameters first
4. Fine-tune entry/exit conditions based on performance metrics
5. Validate with out-of-sample testing
## Performance Considerations
### Strengths
- Adaptability to different market conditions through dual channels
- Multiple layers of confirmation reducing false signals
- Comprehensive risk management protecting capital
- Machine learning integration for predictive edge
### Limitations
- Complex parameter set requiring careful optimization
- Potential over-optimization risk with so many variables
- Computational intensity of MLMA calculations
- Dependency on proper webhook configuration for execution
### Best Practices
- Start with conservative risk settings (1-2% of equity)
- Test thoroughly in demo environment before live trading
- Monitor performance regularly and adjust parameters
- Consider market regime changes when evaluating results
## Conclusion
The ₿ober XM v2.0 represents a significant evolution in trading strategy design, combining traditional technical analysis with machine learning elements and multi-timeframe analysis. The core strength of this system lies in its adaptability and recognition of market asymmetry.
### Market Asymmetry and Adaptive Approach
The strategy acknowledges a fundamental truth about markets: bullish and bearish phases behave differently and should be treated as distinct environments. The dual-channel system with separate parameters for long and short positions directly addresses this asymmetry, allowing for optimized performance regardless of market direction.
### Targeted Backtesting Philosophy
It's counterproductive to run backtests over excessively long periods. Markets evolve continuously, and strategies that worked in previous market regimes may be ineffective in current conditions. Instead:
- Test specific market phases separately (bull markets, bear markets, range-bound periods)
- Regularly re-optimize parameters as market conditions change
- Focus on recent performance with higher weight than historical results
- Test across multiple timeframes to ensure robustness
### Multi-Timeframe Analysis as a Game-Changer
The integration of multi-timeframe analysis fundamentally transforms the strategy's effectiveness:
- **Increased Safety**: Higher timeframe confirmations reduce false signals and improve trade quality
- **Context Awareness**: Decisions made with awareness of larger trends reduce adverse entries
- **Adaptable Precision**: Apply strict filters on lower timeframes while maintaining awareness of broader conditions
- **Reduced Noise**: Higher timeframe data naturally filters market noise that can trigger poor entries
The ₿ober XM v2.0 provides traders with a framework that acknowledges market complexity while offering practical tools to navigate it. With proper setup, realistic expectations, and attention to changing market conditions, it delivers a sophisticated approach to systematic trading that can be continuously refined and optimized.

SuperTrade ST1 StrategyOverview
The SuperTrade ST1 Strategy is a long-only trend-following strategy that combines a Supertrend indicator with a 200-period EMA filter to isolate high-probability bullish trade setups. It is designed to operate in trending markets, using volatility-based exits with a strict 1:4 Risk-to-Reward (R:R) ratio, meaning that each trade targets a profit 4× the size of its predefined risk.
This strategy is ideal for traders looking to align with medium- to long-term trends, while maintaining disciplined risk control and minimal trade frequency.
How It Works
This strategy leverages three key components:
Supertrend Indicator
A trend-following indicator based on Average True Range (ATR).
Identifies bullish/bearish trend direction by plotting a trailing stop line that moves with price volatility.
200-period Exponential Moving Average (EMA) Filter
Trades are only taken when the price is above the EMA, ensuring participation only during confirmed uptrends.
Helps filter out counter-trend entries during market pullbacks or ranges.
ATR-Based Stop Loss and Take Profit
Each trade uses the ATR to calculate volatility-adjusted exit levels.
Stop Loss: 1× ATR below entry.
Take Profit: 4× ATR above entry (1:4 R:R).
This asymmetry ensures that even with a lower win rate, the strategy can remain profitable.
Entry Conditions
A long trade is triggered when:
Supertrend flips from bearish to bullish (trend reversal).
Price closes above the Supertrend line.
Price is above the 200 EMA (bullish market bias).
Exit Logic
Once a long position is entered:
Stop loss is set 1 ATR below entry.
Take profit is set 4 ATR above entry.
The strategy automatically exits the position on either target.
Backtest Settings
This strategy is configured for realistic backtesting, including:
$10,000 account size
2% equity risk per trade
0.1% commission
1 tick slippage
These settings aim to simulate real-world conditions and avoid overly optimistic results.
How to Use
Apply the script to any timeframe, though higher timeframes (1H, 4H, Daily) often yield more reliable signals.
Works best in clearly trending markets (especially in crypto, stocks, indices).
Can be paired with alerts for live trading or analysis.
Important Notes
This version is long-only by design. No short positions are executed.
Ideal for swing traders or position traders seeking asymmetric returns.
Users can modify the ATR period, Supertrend factor, or EMA filter length based on asset behavior.

Dumb Money ConceptUse in 1 minute timeframe
1. Strategy setup
Name & sizing: Trades 25% of your account on each signal, assumes 0.04% commission + 2‑tick slippage, starts with a notional 10 million.
Timing: Only makes decisions at each 1‑minute bar close, and processes orders at bar‑close.
2. Optional filters (both default to off)
Volatility filter : when on, requires that yesterday’s ATR (average true range) ≥ your threshold before even placing an entry.
Trend filter : when on, only allows a “long” if yesterday’s close was above its daily MA, or a “short” if below.
You can toggle each filter on/off and adjust ATR period, ATR threshold, and MA length through the inputs at the top.
3. Signal logic (“dumb money” wicks)
At today’s first minute, the script pulls yesterday’s open, high, low, close, ATR and MA—using only completed daily bars so nothing repaints.
It measures the size of yesterday’s upper wick (close→high) vs. lower wick (open→low).
If the upper wick was longer, that sets a long bias (“dumb money” got shaken out at the top). Otherwise it sets a short bias.
4. Calculate where to place orders
On that same first minute of day:
Entry: a limit order at half of yesterday’s range away from today’s open (below the open for longs, above for shorts).
Stop‑loss: one full‑range (×1.0) below today’s open for longs (and above for shorts).
Take‑profit: 1.236× yesterday’s range above today’s open for longs (and below for shorts).
5. Apply filters before sending entry
Before actually placing that limit order, it checks:
Volatility: if enabled, requires yesterday’s ATR ≥ your “Min Daily ATR.”
Trend: if enabled, requires yesterday’s close to lie on the same side of its daily MA as your signal.
If either filter fails, no order is sent.
6. Give the limit order up to 24 hours to fill
The code remembers the bar‑index when the order went live.
If 1440 one‑minute bars pass (≈24 h) without a fill, it automatically cancels the unfilled entry—so stale orders don’t hang around.
7. Once filled, TP/SL manage the trade
As soon as your limit order executes, two opposite orders are placed:
A take‑profit at the 1.236× range level
A stop‑loss at the –1.0× range level
One cancels the other when triggered.
8. No overnight risk
On the very first minute of the next daily bar, any position still open is force‑closed (“Time Exit”)